25 March 2026, 17:48
READ THE PRESS RELEASE
GROSS MARGIN AT EURO 10.7 MILLION CONFIRMS GROWTH TREND, +1% COMPARED TO THE JULY – DECEMBER 2024 PERIOD
EBITDA AT EURO 5.9 MILLION, –10% COMPARED TO THE JULY – DECEMBER 2024 PERIOD
FINANCIAL CALENDAR FOR FY 2026–2027 APPROVED
Key results for the July–December 2025 period:
- Revenues at EUR 155.4 million, -8% compared to euro 7 million in the July–December 2024 period;
- Average energy commodity index (electricity and gas) at euro 102/MWh, -13% compared to the July–December 2024 period;
- Gross Margin at EUR 10.7 million, +1% compared to euro 6 million in the July–December 2024 period;
- EBITDA[1] at EUR 5.9 million, -10% compared to euro 5 million in the July–December 2024 period;
- Net profit at EUR 3.0 million, -13% compared to euro 5 million in the July–December 2024 period;
- Net Financial Position at euro 9.5 million (positive cash position), compared to a positive Net Financial Position of approximately EUR 9.2 million as of June 30, 2025, and euro 11.3 million as of December 31, 2024
Saluzzo (CN), 25 March 2026 – the Board of Directors of eVISO S.p.A. (symbol: EVISO) – technology company, listed on the EGM, operating in the electricity, gas and fruit sectors –– meeting today, examined and approved the Half-Year Report as of 31 December 2025, prepared in accordance with the Euronext Growth Milan Issuers’ Regulation and in compliance with Italian accounting standards.
Lucia Fracassi, Chief Executive Officer of eVISO, commented: “The growth in Gross Margin to euro 10.7 million, higher than all previous half-year periods, confirms the effectiveness of the investments made in developing the direct sales network and strengthening the reseller channel. In the chart below, which shows the trend of the average monthly Gross Margin, the growth trend is also evident in the first months of 2026. This figure reflects the ability of the eVISO platform to convert volume growth into value creation, progressively increasing operational efficiency and execution quality. EBITDA, equal to euro 5.9 million, down from euro 6.5 million in the July–December 2024 period, reflects the increase in commercial costs, which is strategic for growth across all business segments. I am confident that the ongoing investments will contribute to an increase in Gross Margin in the next half-year period”.
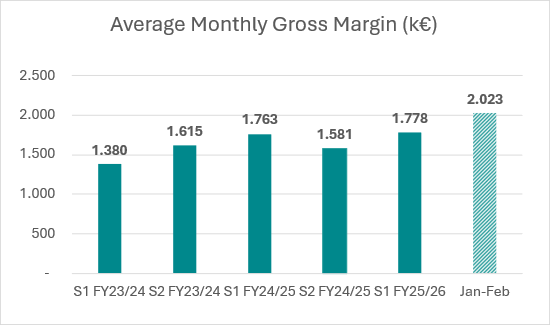
Historical trend of the average monthly Gross Margin. Monthly average starting from the first half of the year, July – December 2023 (H1 FY23/24). Data expressed in thousands of euros (k€). The histogram on the right, equal to 2,023 thousand euros, represents the average Gross Margin for the first two months of 2026, January and February (management estimated data).
Gianfranco Sorasio, Chief Executive Officer of eVISO, commented: “Over the past 20 years, the electricity sector in Italy has added to the traditional activities of generation, transmission and distribution – typical of utilities – a series of entirely new opportunities linked to the massive digitalization of the segment. The number of annual readings available has increased 40,000 times, reaching 1 trillion readings per year in 2025. The number of offers that operators can present in the energy market has increased 4,500 times since the launch of PUN in 2004. The same digitalization process is now rapidly expanding in the gas segment.
eVISO has developed seven distinct proprietary technologies: 1) Capture & Store Big Data; 2) Forecast & High Frequency Trading; 3) High Frequency Procurement & Dispatch; 4) Alerts & B2B Interfaces (CORTEX LUCE, gas, etc.); 5) Billing and Payments; 6) High Frequency Finance & Treasury; 7) Big Data Sales & Marketing. I believe that proprietary technology modules are essential components for building a meaningful position in the electricity and gas segments at both national and international level. I also believe that proprietary technologies ensure a leading role in building significant market positions in emerging technology segments”.
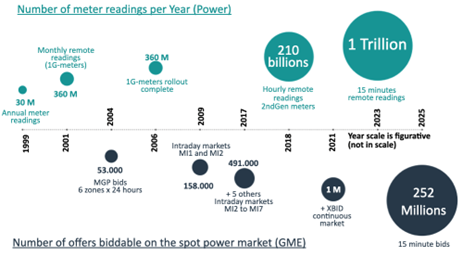
Evolution of the digitalization of the Italian electricity system since 1999. The value near the bubbles (upper part) indicates the number of annual readings available for the approximately 30 million Italian users. The size of the bubbles is proportional to the number of readings. Lower part. The value near the bubbles indicates the number of bids that can be submitted to the Italian electricity market (GME) since the launch of the Day-Ahead Market in 2004. The size of the bubbles, proportional to the number of submittable market bids, is on a different scale from the upper chart. In 2017, the MI3-MI4-MI5-MI6-MI7 markets were added to the MI1-MI2 intraday markets. XBID indicates the continuous market.
In the first half of FY 2025–2026 (July – December 2025), eVISO recorded revenues of euro 155.4 million, down 8% compared to the same period of the previous year, mainly due to the reduction in the average price of energy and gas (average index of euro 102.8/MWh), which declined significantly compared to the reference period (-13%), with a consequent impact on revenues despite positive volume dynamics (overall +1%)[2].
The chart below shows the average monthly Gross Margin (GM) for the half-year just ended and a comparison with the monthly averages of previous half-year periods. While the average monthly figure for the current half-year is in line with the same period of the previous financial year (S1 FY24/25), the chart highlights both the growth of the current half-year compared to the previous one (+12%), and the increase recorded in the first two months of 2026 compared to the current half-year (+14%). The chart clearly shows the increase in the average monthly GM starting from July 2025, reflecting the effects of investments supporting commercial growth and the development of the operational structure.
Historical trend of the average monthly Gross Margin. Monthly average value starting from the first half-year July – December 2023 (H1 FY23/24). Data expressed in thousands of euros (k€). The histogram on the right, equal to 2,023 thousand euros, represents the average Gross Margin for the first two months of 2026, January and February (management estimates).
EBITDA amounted to euro 5.9 million, slightly down from EUR 6.5 million in the same half-year of the previous year (July–December 2024), and up 46% compared to EUR 4.0 million in the previous half-year (January – June 2025). The chart below illustrates the trend in half-year EBITDA over the last three financial years.
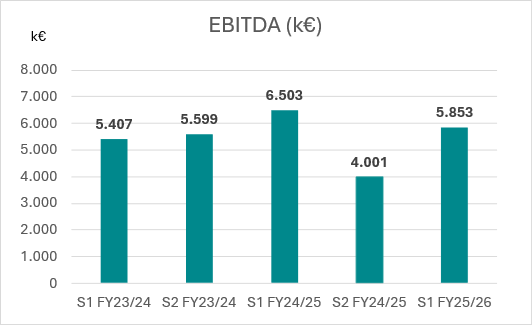
Historical trend of semi-annual EBITDA evolution starting from the first half of fiscal year 23/24, July – December 2023 (H1 – FY23/24). Data expressed in thousands of euros (k€). EBITDA for the first half of fiscal year 25/26, July – December 2025 (H1 FY25/26), is 46% higher than the previous semester and shows a 10% contraction compared to the first half of fiscal year 24/25, July – December 2024 (H1 FY24/25).
Net Profit amounted to euro 3.0 million, down 13% compared to the July–December 2024 half-year (euro 3.5 million) and up 117% compared to the January–June 2025 half-year (euro 1.4 million).
The half-year results reflect two main development dynamics.
The first concerns the growth of the direct sales channel, supported by investments in the commercial infrastructure made in the previous financial year. During the period, total energy volumes (electricity and gas) in the direct channel grew by +27% YoY, with positive contributions from all main commercial channels: sales network (+23%), agencies (+57%), retail (+641%) and digital channel (60x). The development of the gas segment in the reseller channel follows the same positive trajectory, with an increase of 20x YoY.
The second dynamic concerns the electricity segment in the reseller channel: following an initial phase of deliberate short-term contraction implemented in the previous financial year to improve reseller quality – i.e. an explicit trade-off on less profitable volumes (-15% YoY), also in light of significant regulatory changes at the end of 2025 – a phase of strong volume recovery began in November. In particular, in February 2026, annual electricity volumes in the reseller channel associated with eVISO increased by 113 GWh (+14%), reaching a record level of 902 GWh.
KEY FINANCIAL RESULTS AS OF 31 DECEMBER 2025
Revenues amounted to euro 155.4 million, down 8% compared to euro 169.7 million in the same period of the previous year, due to the reduction in the average energy price, partially offset by volume growth in the higher-growth segments. The energy price (“average Index”[3]) decreased from EUR 118.2/MWh in the July – December 2024 period to EUR 102.8/MWh in the July – December 2025 period.
Below is a breakdown of revenues by operating segment and total Gross Margin:
| €/M | S1 FY 25/26 | % | S1 FY 24/25 | % | VAR% |
| ELECTRICITY DIRECT CHANNEL | 50.3 | 32% | 47.4 | 28% | 6% |
| ELECTRICITY RESELLER CHANNEL | 83.9 | 54% | 106.7 | 63% | -21% |
| NATURAL GAS DIRECT CHANNEL | 5.3 | 3% | 3.6 | 2% | 48% |
| NATURAL GAS RESELLER CHANNEL | 0.8 | 1% | 0.0 | 0% | 1653% |
| ANCILLARY SERVICES, BIG DATA | 2.8 | 2% | 3.4 | 2% | -18% |
| SMARTMELE SERVICES | 0.1 | 0% | 0.1 | 0% | -9% |
| ELECTRICITY TRADING | 12.1 | 8% | 8.4 | 5% | 44% |
| TURNOVER | 155.4 | 169.7 | -8% | ||
| AVERAGE INDEX €/MWh | 102,8 | 118.2 | -13% | ||
| GROSS MARGIN | 10.7 | 10.6 | 1% |
The Gross Margin amounted to euro 10.7 million, up from euro 10.6 million in the same half-year of the previous year, and higher than all previous half-year periods. The growth compared to the previous half-year (+14%) reflects the success of investments in expanding the sales network and in sales strategies targeting reseller operators.
- POWER
Total electricity delivered amounted to 583 GWh, down 5% compared to 614 GWh in the July – December 2024 period, of which 361 GWh related to the reseller channel (down 15% compared to 425 GWh in the July – December 2024 period) and 222 GWh related to the direct channel (up 27% compared to 189 GWh in the July – December 2024 period).
Points of delivery (PODs) decreased by 10% (compared to 213,028 PODs managed in the July – December 2024 period), reaching 190,852, of which 28 thousand in the direct channel (+23% YoY) and 163 thousand (-14% YoY) managed by the 102 resellers associated with eVISO, representing approximately 13% of the total number of active sales operators in the free market (782), according to the Electricity Sales Operators List (EVE) of the Ministry of Environment and Energy Security, updated as of 31 December 2025. In addition, the total number of PODs includes a retail customer component (1,853 PODs), more than 9 times higher than the 205 supply points in the July – December 2024 period, in line with the company’s strategy to penetrate this segment.
In terms of customer base quality, eVISO continues to focus on the stability of recurring revenues. The initiatives launched in the first half of FY 25/26 for the digital transformation of the customer experience in the direct channel have introduced a new operating model based on a single, highly specialised team, with the aim of further strengthening customer retention and operational scalability.
In terms of profitability, the Gross Margin of the direct channel amounted to euro 5.5 million (+3% compared to euro 5.4 million in the July – December 2024 period), while the Gross Margin of the reseller channel amounted to euro 3.7 million (-19% compared to EUR 4.6 million in the July 2024 – June 2025 period). Below are the charts illustrating the trend in total Gross Margin and volumes in the electricity segment for both the direct and reseller channels:
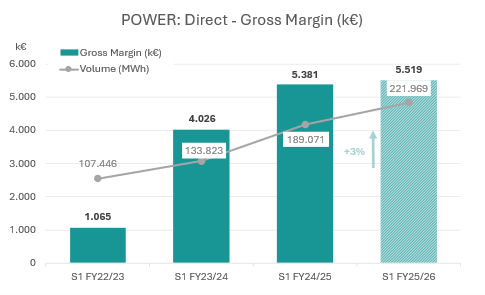
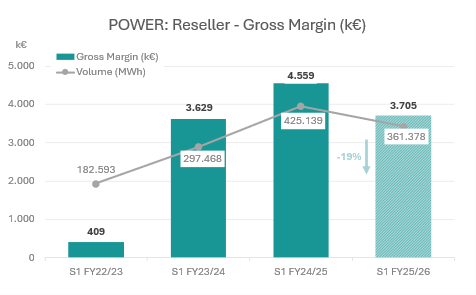
Electricity Segment. Charts expressed in thousands of euros (k€). The chart on the left presents the historical Gross Margin trend for the direct channel in the histograms, starting from the first half of fiscal year 22/23, July–December 2022 (H1 FY22/23). The line represents the delivered volumes (MWh) over the same periods. The chart on the right presents the same parameters for the reseller channel.
In unitary terms, the Gross Margin for direct customers decreased from28.46 €/MWh in the July 2024 – December 2024 period to 24.86 €/MWh, recording a 13% contraction. This was due to a different customer mix resulting from the commencement of supply to large industrial groups with material volumes. The unitary Gross Margin for reseller customers moved from 10.72 €/MWh in the July – December 2024 period to10.25 €/MWh. Below are two charts illustrating the unitary Gross Margin trends for the electricity segment across both the direct and reseller channels:
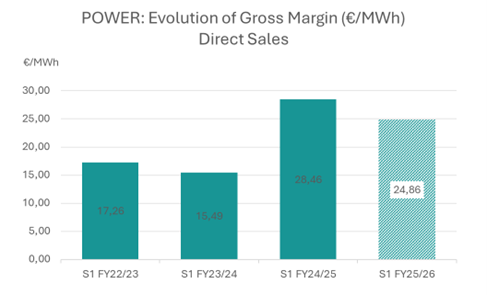
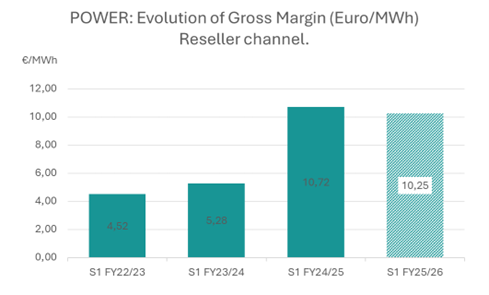
Electricity Segment. Historical trend of the Gross Margin (€/MWh). The chart on the left presents the Gross Margin (€/MWh) evolution for the direct channel, starting from the first half of fiscal year 22/23, July–December 2022 (H1 FY22/23). The chart on the right presents the same parameters for the reseller channel.
In March 2026, electricity volumes associated with eVISO—as reported by the Integrated Information System (SII), the public entity managing information flows for the electricity and gas markets—stood at 1,409 GWh, of which 889 GWh related to the reseller channel and 520 GWh to the direct channel.
- GAS
Total gas delivered reached 81.7 GWh, an increase of 97% compared to the 41.5 GWh recorded in the July 2024 – December 2024 period. In this financial period as well, the direct channel remains the predominant market with 70.4 GWh.
Total Points of Delivery (PDR) reached 11,662, marking a +163% increase compared to the 4,428 PDRs managed in the July – December 2024 period. Of these, 6,835 belong to the direct channel—where growth was driven by commercial activities that increased the acquisition of new industrial customers with significant gas consumption—and 4,827 relate to the reseller channel.
Regarding profitability, the Gross Margin of the direct channel reached euro 1.0 million (+156% compared to €0.4 million in the July 2024 – December 2024 period), while the Gross Margin of the reseller channel stood at euro 84 thousand (+1301% compared to euro 6 thousand in the July – December 2024 period). Below are two charts illustrating the trend of Gross Margin and volumes in the gas segment for both direct and reseller channels:
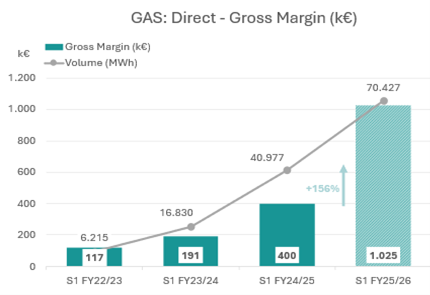
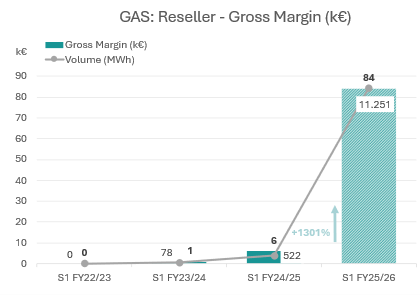
Natural Gas Segment. Charts expressed in thousands of euros (k€). The chart on the left presents the historical Gross Margin trend for the direct channel in the histograms, starting from the first half of fiscal year 22/23, July–December 2022 (H1 FY22/23). The line and the legends above the line represent the delivered volumes (MWh) over the same periods. The chart on the right presents the same parameters for the reseller channel.
In unitary terms, the Gross Margin for direct customers increased by 49% compared to the July – December 2024 period, reaching 14.55€/MWh. This improvement is due to a more diversified customer base and the completed integration of the entire gas supply chain following a technology platform upgrade. This allowed for the direct management of purchases on the national exchange (GME), transport via the national SNAM network, and physical delivery to industrial, business, and domestic delivery points (PDR) (ref. press release of February 25, 2025). The unitary Gross Margin for reseller customers moved from 11.49€/MWh in the July – December 2024 period to 7.47€/MWh. This reduction in margin is attributed to the increase in volumes and points managed, which required a broader differentiation of commercial offers for resellers. Below are two charts illustrating the unitary Gross Margin trends for the gas segment in the direct and reseller channels:
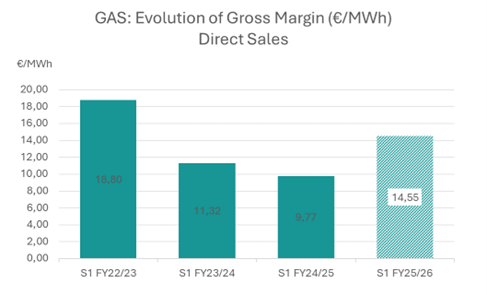
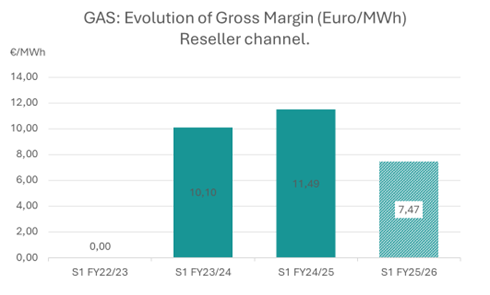
Natural Gas Segment. Historical trend of the Gross Margin (€/MWh). The chart on the left presents the Gross Margin (€/MWh) evolution for the direct channel, starting from the first half of fiscal year 22/23, July–December 2022 (H1 FY22/23). The chart on the right presents the same parameters for the reseller channel.
In March 2026, gas volumes associated with eVISO, as reported by the SII, reached 236 GWh, of which 50 GWh referred to the reseller channel and 186 GWh to the direct channel.
- ANCILLARY SERVICES AND BIG DATA
Billable ancillary services totaled 16,358, compared to approximately 16,500 provided in the July – December 2024 period. The sector recorded a Gross Margin of euro 339 thousand, up 46% from the euro 232 thousand in the July – December 2024 semester. This growth is driven by a 47% increase in the average Gross Margin per service, which rose from 14.1 €/service in the July – December 2024 semester to 20.7 €/service.
- SMARTMELE
In the period July – December 2025, 735 tons of fruit were delivered (+54% compared to the 476 tons in the same period of the previous financial year).
***
Operating expenses recorded an 8% decrease, falling from euro 163.7 million to euro 150.2 million YoY, driven by a reduction in procurement costs and related distribution costs, primarily within the electricity segment. Personnel costs increased by approximately 25% (from euro 2.0 million to euro 2.5 million), with the total number of employees and collaborators rising from 149 to 160 as of December 31, 2025. This increase reflects strategic commercial investments aimed at driving growth.
EBITDA (Gross Operating Margin) amounted to euro 5.9 million, a 10% contraction compared to the euro 6.5 million recorded in the same period of the previous fiscal year. This result was impacted by higher costs associated with strengthening the sales structure and growth investments initiated in the prior semester. As previously noted, EBITDA shows a significant improvement over the preceding semester, benefiting from the progressive full-scale implementation of business development initiatives.
Net Income stood at euro 3.0 million, representing a 13% decrease YoY (euro 3.5 million) but a 117% increase compared to the previous semester (euro 1.4 million).
BALANCE SHEET
The Net Financial Position (NFP) is cash-positive at euro 9.5 million, compared to a positive NFP of approximately €9.2 million as of June 30, 2025, and €11.3 million as of December 31, 2024.
Total liquidity (cash) as of December 31, 2025, amounts to euro 23.8 million, consisting of euro 23.3 million in cash and cash equivalents and euro 0.5 million in time deposits. Total financial debt stands at euro 14.3 million.
The following charts illustrate the primary factors influencing the NFP as of December 31, 2025, and its overall evolution:
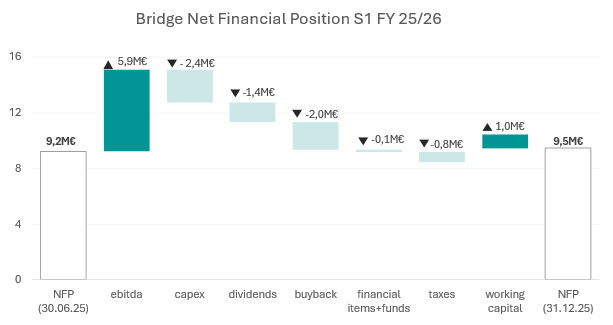
The chart indicates the changes in the net financial position, in millions of euros (€M), occurring during the July 2025 – December 2025 period (H1 FY25/26). The fiscal period was positively influenced by EBITDA and net working capital, while there was an absorption resulting from dividend distribution, the purchase of treasury shares, taxes, and delta CAPEX (intangible, tangible, and financial assets). The item “financial items+funds” includes financial charges and changes in funds.
Below is a chart highlighting the composition of the Net Financial Position and its evolution[4]:
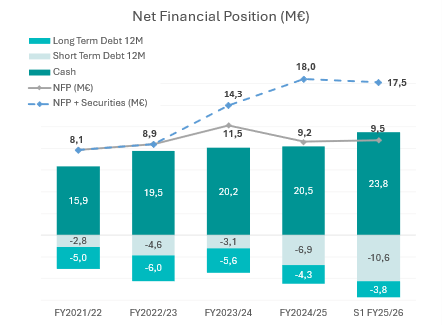
Composition and evolution of the Net Financial Position in millions of euros (€M). The upper part of the histograms represents the positive components (cash and time deposits) of the Net Financial Position. The lower part represents the debt composition divided into Long-Term Debt and Short-Term Debt. The solid line highlights the Net Financial Position in millions of euros (€M). The dashed line identifies the sum of the Net Financial Position and securities. Securities consist of the contribution of treasury shares held in the portfolio, which as of 12/31/2025 amount to 1,362,940 units, of which 650,000 are allocated to two stock option plans for collaborators. (Source: management).
Shareholders’ Equity as of December 31, 2025, totals euro 20.8 million, a 2% decrease compared to euro 21.1 million as of June 30, 2025.
INVESTMENTS
Intangible Assets (~ euro 20.5 million): Primarily comprised of the development of the proprietary platform and brands. This includes rights to internally developed software (partially consisting of personnel costs and internal/external consultancy), technological equipment, and advanced sensors for consumption measurement. It also covers brand revaluation and costs associated with acquiring new commercial contracts.
Tangible Assets (euro 12.7 million): Mainly related to the new corporate headquarters, including relevant fittings, infrastructure, furniture, and electronic office equipment.
Financial Investments (~ euro 1.8 million): Primarily consisting of equity stakes and security deposits held with institutional electricity and gas suppliers.
***
KEY HIGHLIGHTS: FIRST SIX MONTHS OF THE FISCAL YEAR
July 9, 2025: eVISO released a proprietary AI agent, increasing software development speed by up to 10x. The solution enhances code quality, process efficiency, and platform scalability while reducing reliance on external specialized resources.
July 23, 2025: The Company signed a one-year agreement with a Piedmont-based business consultancy partner, expanding access to power, gas, and energy efficiency for up to 12,000 new private and business clients.
August 27, 2025: The Board reviewed preliminary FY 2024/2025 results, noting record revenues and significant volume growth across all channels and commodities.
September 12, 2025: A major technological upgrade automated over 7,500 hours of administrative tasks, allowing 10 operators to shift from manual work to high-value creative activities.
September 19, 2025: Combined annual gas volumes (direct and reseller) reached 182 GWh (+143% YoY), driven by sales network expansion and the efficiency of the CORTEX GAS platform.
September 24, 2025: The Board approved the draft financial statements as of June 30, 2025, confirming solid results aligned with the growth strategy.
October 27, 2025: The Shareholders’ Meeting approved the FY 2025 financial statements, renewed the share buyback authorization, and granted the Board the power to increase share capital by up to €70 million.
October 28, 2025: Lucia Fracassi was appointed Co-CEO, strengthening corporate governance and strategic oversight.
November 11, 2025 eVISO announced a change in the significant shareholdings of its share capital, in accordance with Euronext Growth Milan regulations.
November 12, 2025: Q1 2025/2026 KPIs were released; despite a drop in the average energy index, the direct channel and gas segment showed continued growth.
November 25, 2025: eVISO secured agreements with PV producers for the direct purchase of 25.2 GWh/year, bolstering its renewable energy sourcing and cost stability.
December 12, 2025: eVISO reported strong growth in gas volumes in the reseller channel for December 2025, as well as a recovery in power volumes, with the 2026 contract pipeline showing significant strengthening.
December 15, 2025: Cerved Rating Agency confirmed eVISO’s A2.2 rating, validating the company’s financial solidity and ability to meet its commitments.
December 17, 2025: eVISO analyzed the Italian power market’s transition to quarter-hour settlements. Thanks to its proprietary platform, the company successfully minimized purchase cost variances.
KEY EVENTS SUBSEQUENT TO THE CLOSE OF THE FIRST HALF OF THE FISCAL YEAR
January 15, 2026: eVISO announced the strong development of its Agency channel, which saw a doubling of supply points within six months in both the power and gas segments. These figures confirm the effectiveness of the commercial expansion strategy and the strengthening of the company’s local presence.
January 22, 2026: The Company reported that annual associated gas volumes exceeded 220 GWh in January 2026, representing an 80% year-over-year (YoY) growth. This result is driven by both the direct and reseller channels and is supported by the reinforcement of the CORTEX GAS platform and expanded distribution network coverage.
February 11, 2026: The Board of Directors reviewed the preliminary half-year results, highlighting robust growth in the gas segment (+105%) and development in the direct channel (+28%). Increasing electricity and gas volumes, coupled with a positive Net Financial Position (NFP), confirm the solidity of the business model.
March 4, 2026: eVISO announced it has increased its direct energy purchases from renewable sources to 93.1 GWh, thanks to new agreements with photovoltaic (PV) plants. This initiative improves the cash conversion cycle and reinforces the direct sourcing strategy, reducing exposure to energy market volatility.
***
OUTLOOK
The energy sector remains exposed to high volatility, influenced by geopolitical tensions and the dynamics of key supply routes. After a phase of relative stability in 2025, the context has become more uncertain, with energy prices once again sensitive to geopolitical risk and with benefits related to the cost of capital now largely exhausted.
In this scenario, competitive differentiation is increasingly focused on technological leverage. eVISO has strengthened its proprietary platform, introducing the European balancing platform PICASSO and adapting to the new 15-minute trading intervals, increasing its capacity for data management and operational complexity. The platform-based business model allows the Company to scale volumes while maintaining operational efficiency.
Over the next 12–18 months, eVISO expects to pursue its development through the strengthening of direct sales to SMEs, the expansion of the reseller and agency channels, the growth of the gas business, the development of the retail presence, the evolution of digital projects, and international expansion in Southern Europe.
In the first months of 2026, commercial results confirmed the growth trajectory: electricity volumes associated with eVISO reached 1,409 GWh (889 GWh reseller and 520 GWh direct), while the gas segment recorded volumes of 236 GWh, driven in particular by the growth of the reseller channel.
Overall, the growth in volumes, the expansion of distribution channels, and the strengthening of the customer base are consistent with the Company’s strategy to maximize platform efficiency, consolidate its competitive advantage, and create sustainable value over time, while continuing to evaluate consolidation opportunities at a European level.
***
FILING OF DOCUMENTS
The documentation relating to the Half-Year Report as of December 31, 2025, as required by current regulations, will be made available to the public at the registered office as well as through publication on the corporate website and on the Borsa Italiana website.
The Income Statement and Statement of Financial Position layouts of the financial statements of eVISO S.p.A. are attached to this press release.
It is specified that the audit activities on the financial statements for the half-year ended December 31, 2025, by the auditing firm have been completed and that the auditing firm’s report will therefore be made available within the terms of the law.
***
FINANCIAL CALENDAR APPROVED
The Board of Directors has also approved, pursuant to Art. 17 of the Borsa Italiana Euronext Growth Milan Regulation, the corporate events calendar for the 2026/2027 fiscal year.
Any changes will be subject to timely disclosure to the market.
| DATE | EVENT |
| 20 May 2026 | Disclosure of preliminary financial data and main KPIs as of March 31, 2026, not subject to audit(i) |
| 27 August 2026 | Board of Directors meeting to review preliminary financial data and main KPIs as of June 30, 2026, not subject to audit(i) |
| 24 September 2026 | Board of Directors meeting to approve the draft financial statements as of June 30, 2026 |
| 26 October 2026 | First call for the Shareholders’ Meeting to approve the financial statements as of June 30, 2026 |
| 27 October 2026 | Second call for the Shareholders’ Meeting to approve the financial statements as of June 30, 2026 |
| 18 November 2026 | Disclosure of preliminary financial data and main KPIs as of September 30, 2026, not subject to audit(i) |
| 18 February 2027 | Board of Directors meeting to review preliminary semi-annual turnover and main KPIs as of December 31, 2026, not subject to audit(i) |
| 25 March 2027 | Board of Directors meeting to approve the half-year financial report as of December 31, 2026, subject to voluntary audit |
(i) KPIs (Gross Margin, number of customers served, revenues) may undergo non-material differences compared to the final financial statement data.
***
This press release is available in the Investor Relations section of the website www.eviso.ai.
[1] EBITDA: Alternative Performance Indicator.
EBITDA (Earnings Before Interest, Taxes, Depreciation and Amortization – Gross Operating Margin) is an alternative performance indicator not defined under Italian accounting standards but used by the Company’s management to monitor and assess its operating performance, as it is not affected by the volatility arising from the various criteria used to determine taxable income, nor by the amount and characteristics of the capital employed or the related depreciation policies.
For eVISO, this indicator is defined as the Profit/(Loss) for the period before depreciation and amortization of tangible and intangible fixed assets, financial income and expenses, and income taxes.
[2] Average Index: average price of electricity and natural gas relative to the total economic value of electricity and natural gas delivered.
[3] Average Index: average price of electricity and natural gas relative to the total economic value of electricity and natural gas delivered.
[4] In the chart, the “NFP + Securities” line highlights the adjustment to the Net Financial Position by taking Securities into account, which are not included in the NFP calculation according to Italian accounting principles. To calculate this value, treasury shares and other non-material options were added to the NFP for the period.